
The app you are using
PID, CPU, RSS, threads, open files and context switches, added up over the app's whole process tree, not one PID. Disk read and write rates, TCP throughput and listening ports per process, sampled from the kernel once a second.
Linux, macOS, Windows. C++20 with Qt 6. Version 0.11.0.
Pick any window and Crowsnest puts that app's CPU, memory, threads, file descriptors, disk and network throughput in a small panel that floats over your desktop. Click once and the same binary opens a full console for the whole machine: host, disks, GPU, sensors, containers, Kubernetes, databases, traces and what the cloud is billing you.
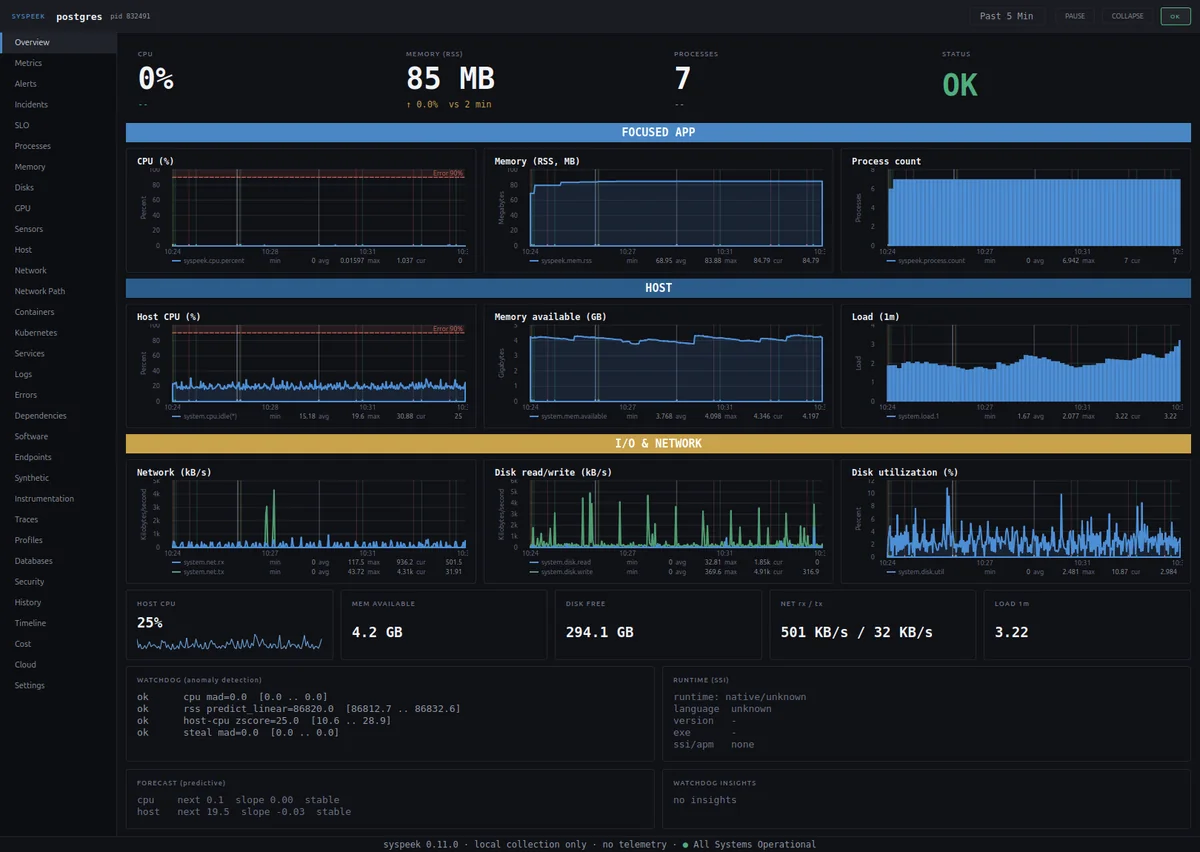
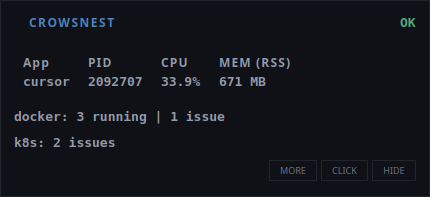
Every panel on this page is a live capture — except the two Cloud panels, marked in the screenshot notes.
What it shows
PID, CPU, RSS, threads, open files and context switches, added up over the app's whole process tree, not one PID. Disk read and write rates, TCP throughput and listening ports per process, sampled from the kernel once a second.
Host CPU and steal, memory, load, per-device disk throughput and utilisation, network interfaces, hwmon temperatures, fans and power, battery health, and GPU utilisation with the process holding it. Anything an OS cannot report is labelled as such, never left blank.
Docker containers with live CPU, memory, network and PIDs through the Engine API. Kubernetes pods, deployments, nodes and metrics-server usage. systemd units, launchd jobs and Windows services. A local PostgreSQL client for cache hit rate, commits, deadlocks and the slowest statements.
OTLP traces, DogStatsD metrics, synthetic HTTP checks and a Prometheus endpoint on the receiving end. Cloud instance identity, accrued cost, the provider's own billed spend, the burn rate against your own trailing baseline, per-pod right-sizing with the headroom priced at your cluster's rates, and Terraform state diffed against the account listing. Alerts correlated into one incident per subject, with an owner and a page only when the rule is not flapping, SLO burn, and webhooks to the receiver you already own.
[cloud] identity= is a fallback — the metadata service always wins when it answers, and the page says which source it used.Screenshots
A 12-core HP laptop running Linux, with three Docker containers, a local PostgreSQL, a single-node Kubernetes cluster, and local OTLP and DogStatsD clients feeding the console. Click any panel for the full frame.
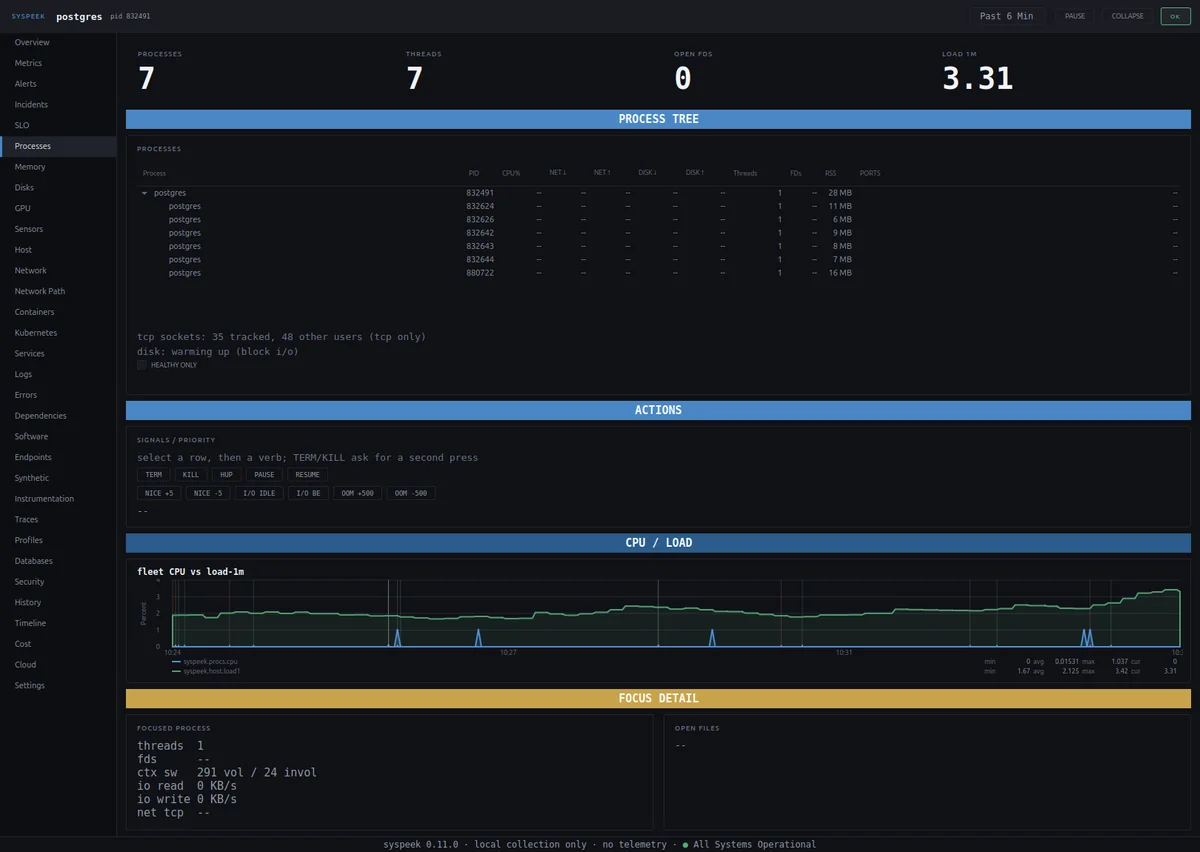
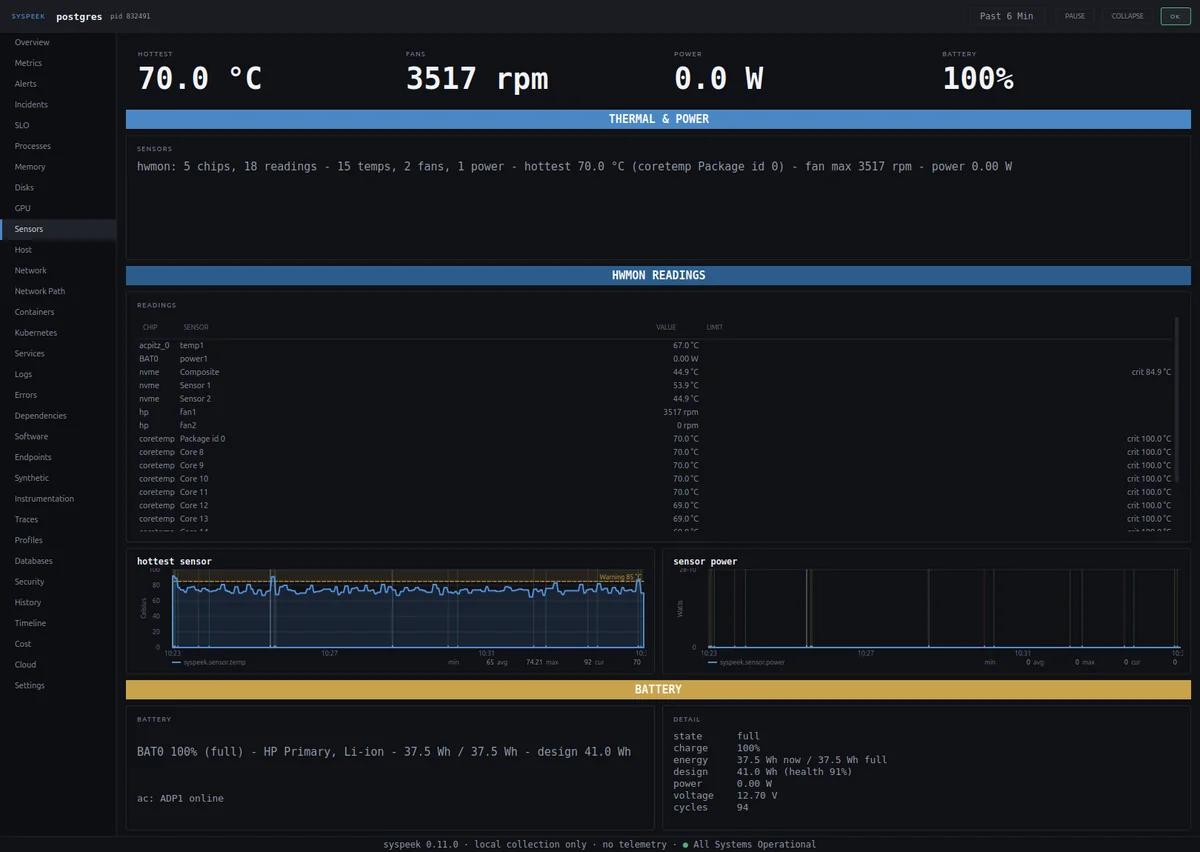
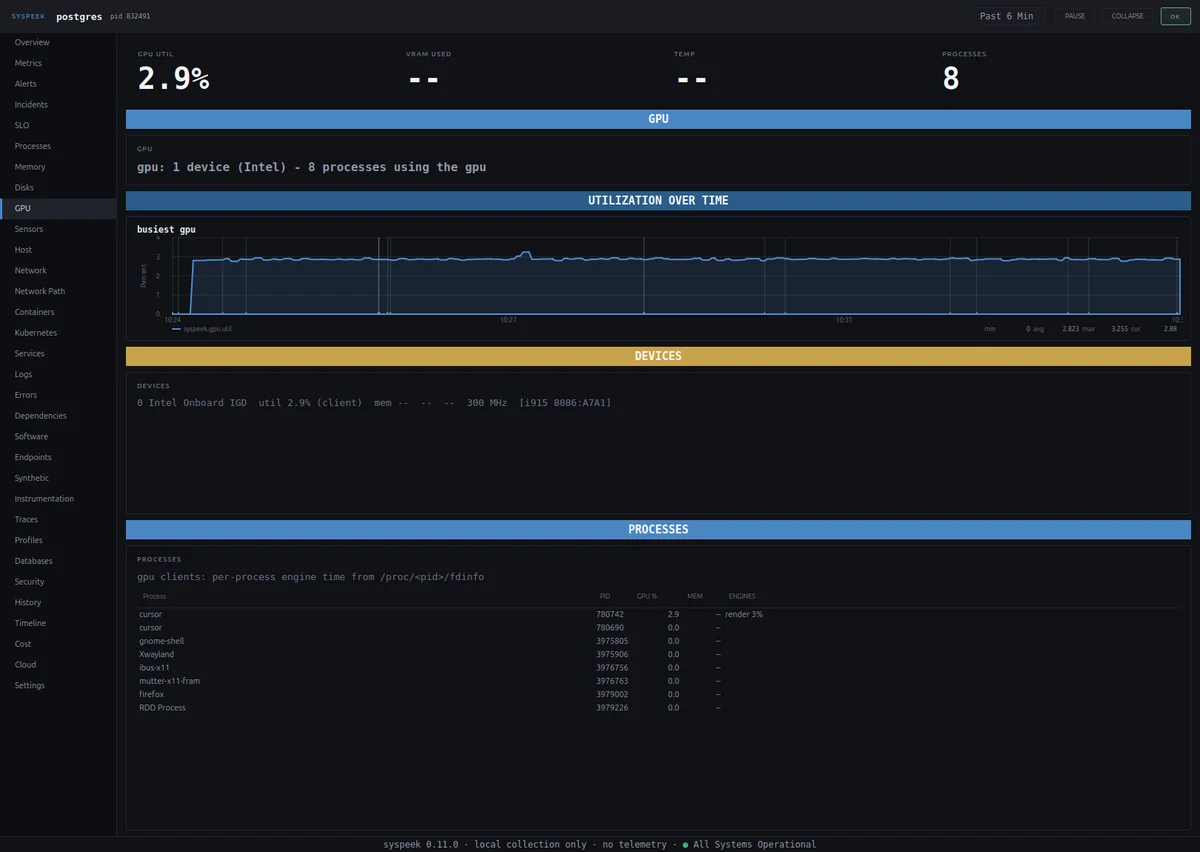
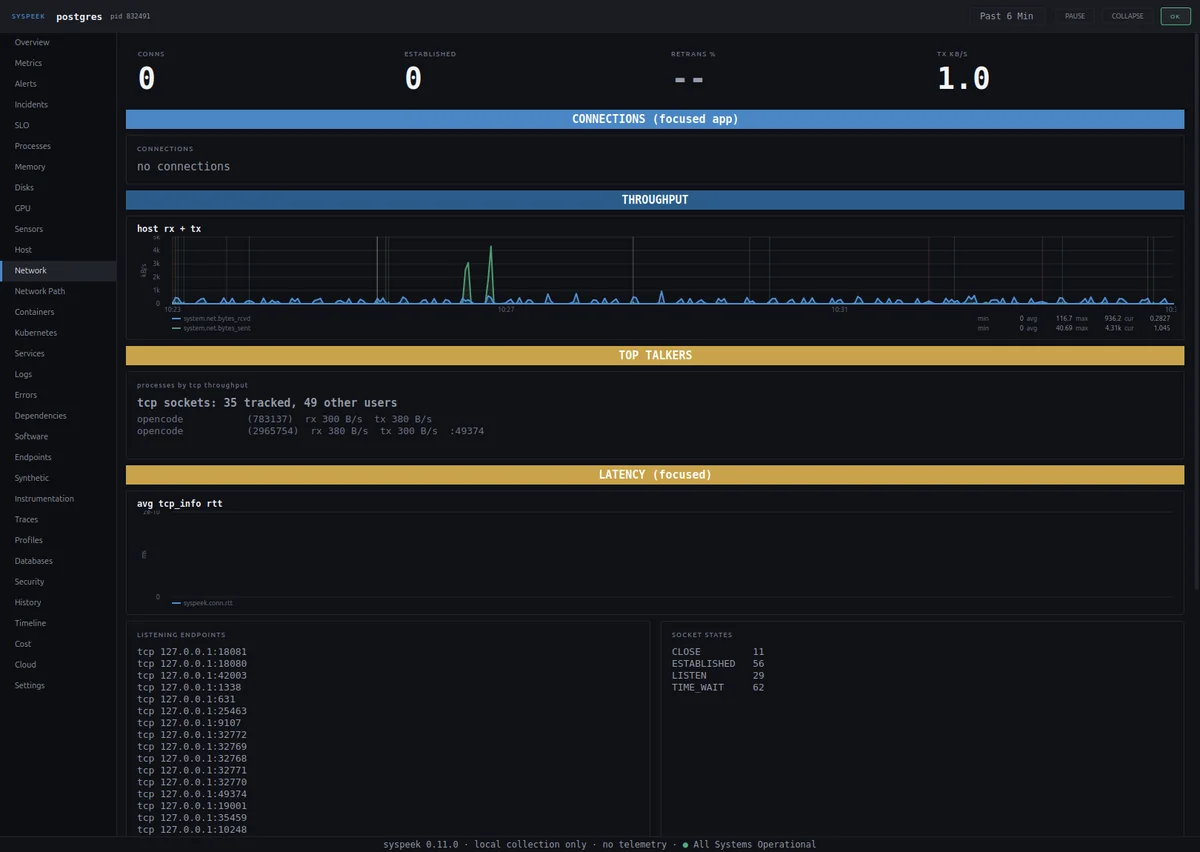
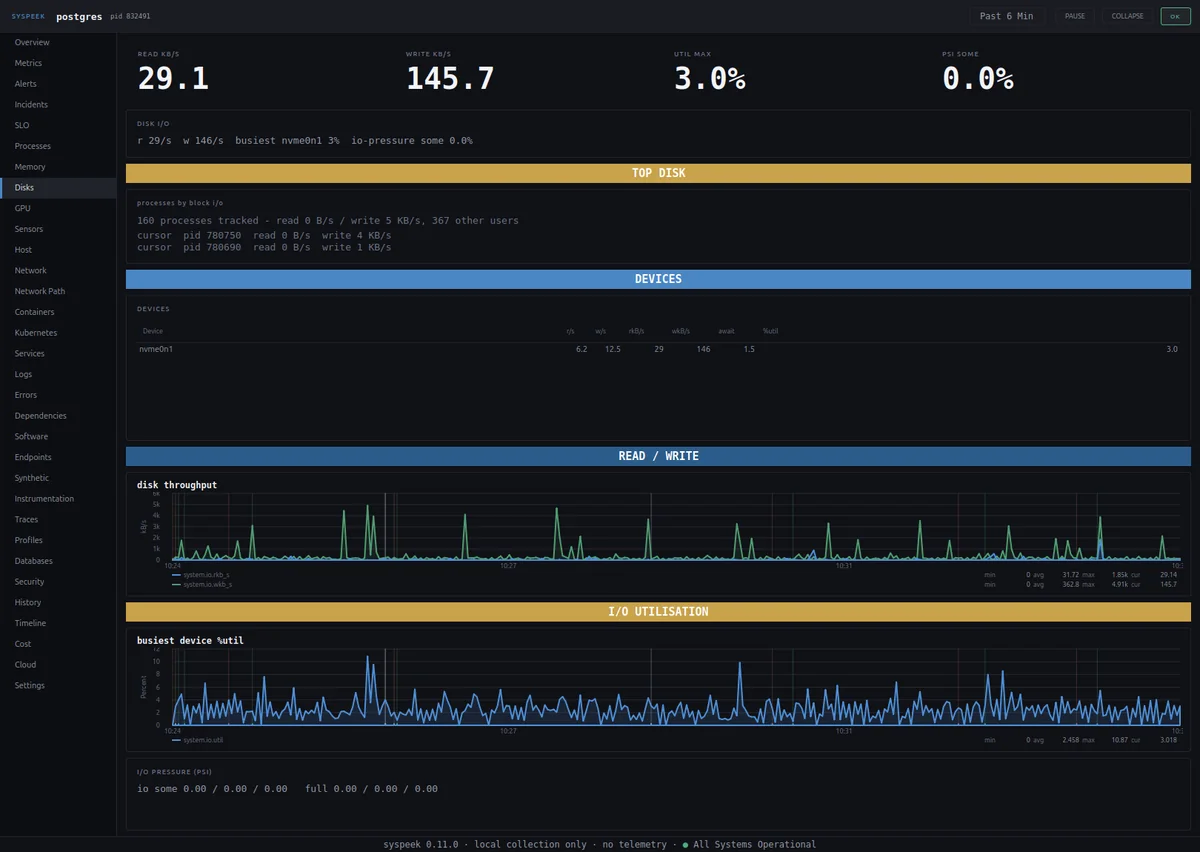
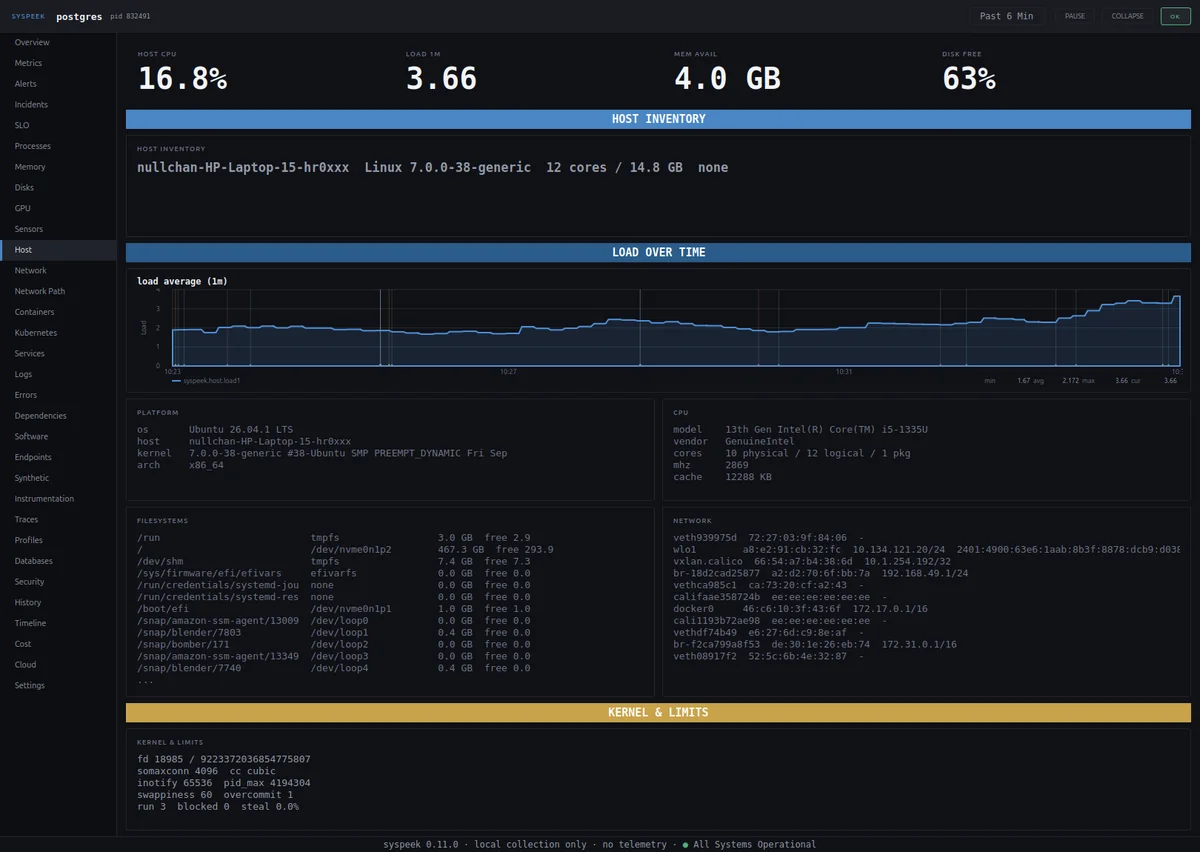
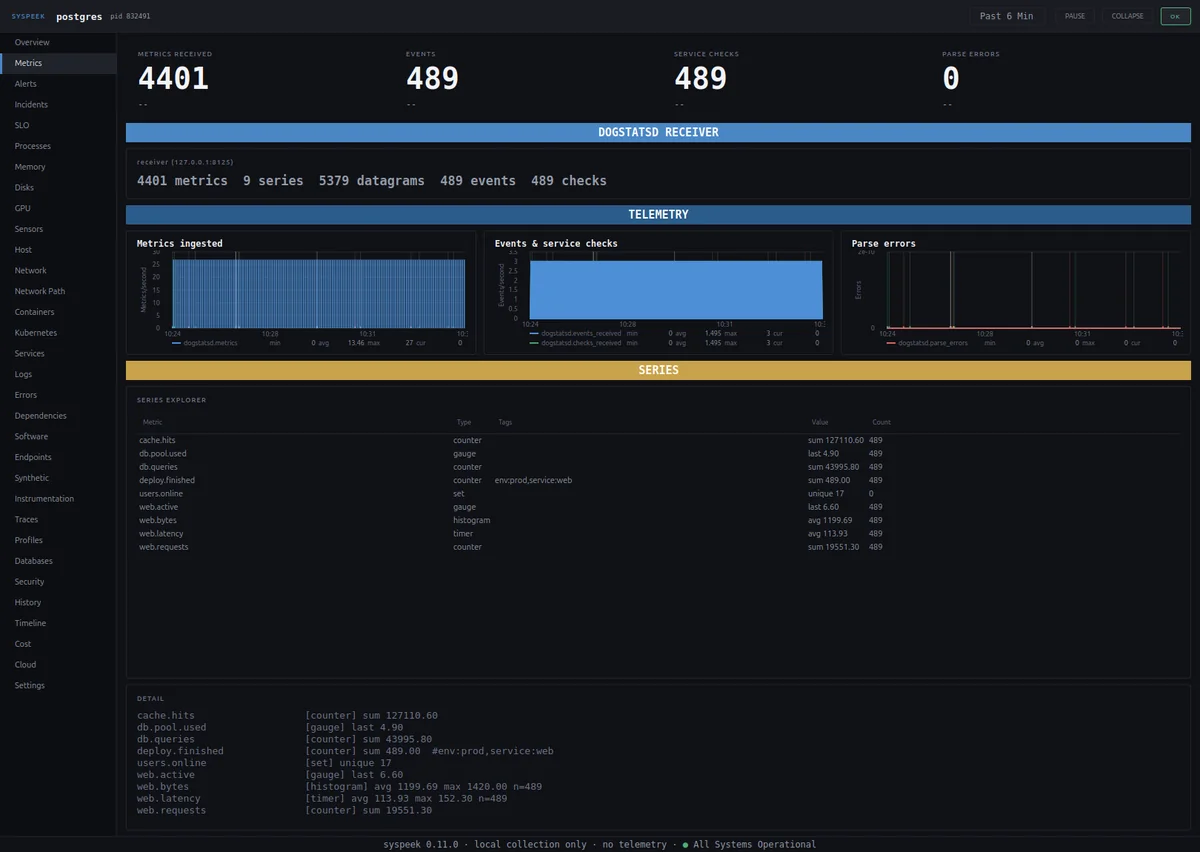
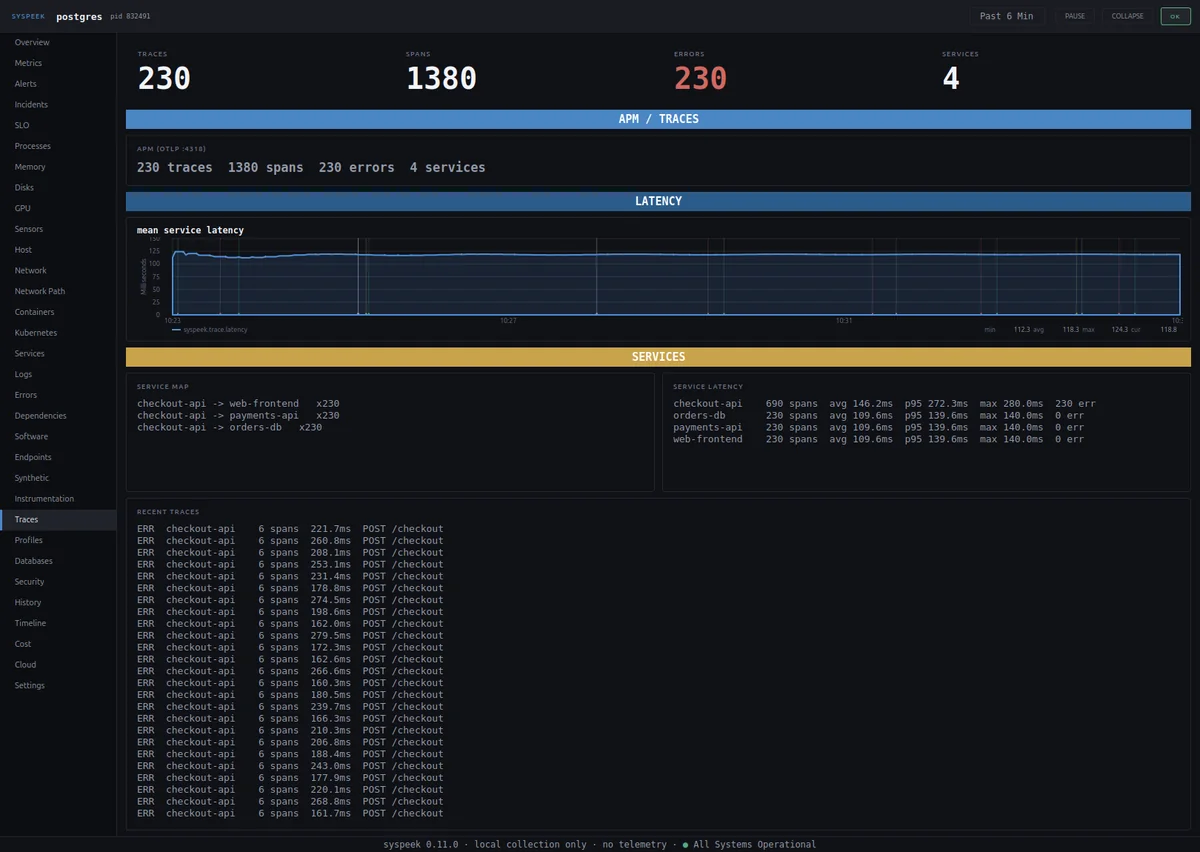
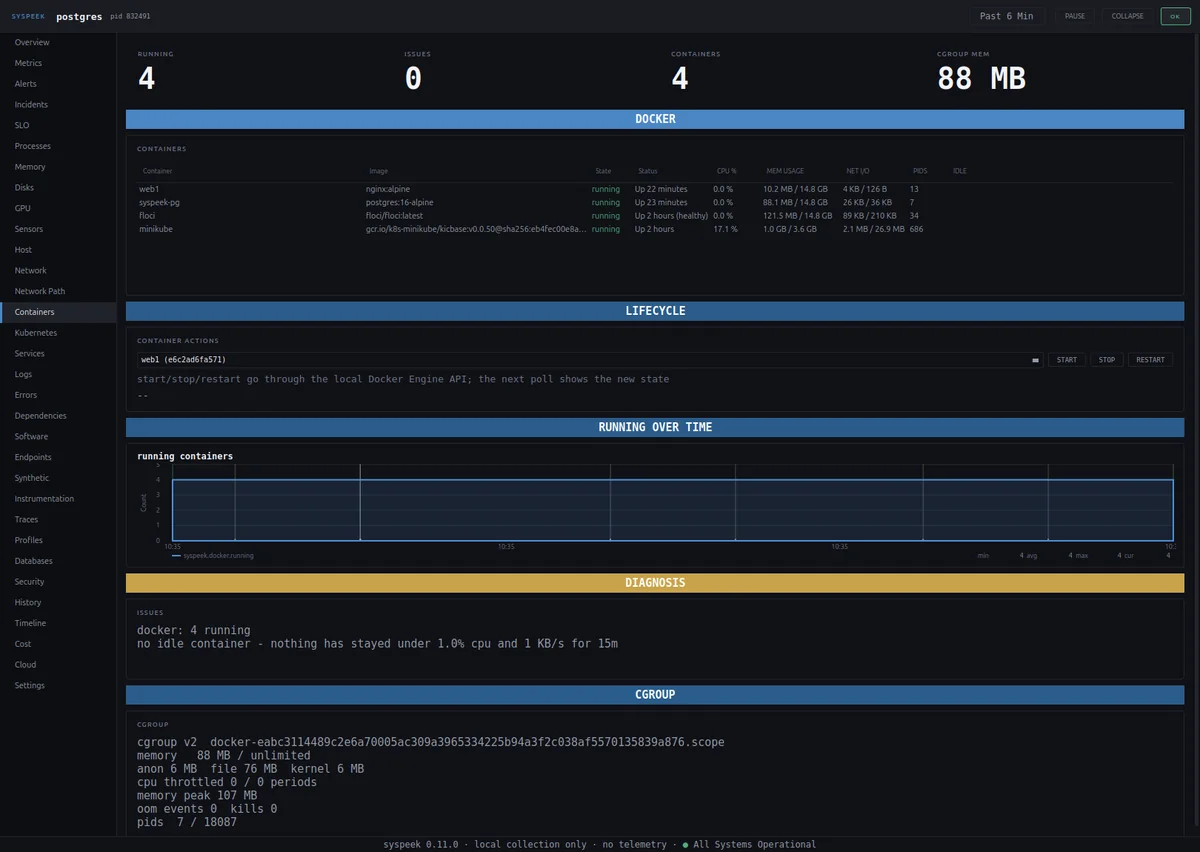
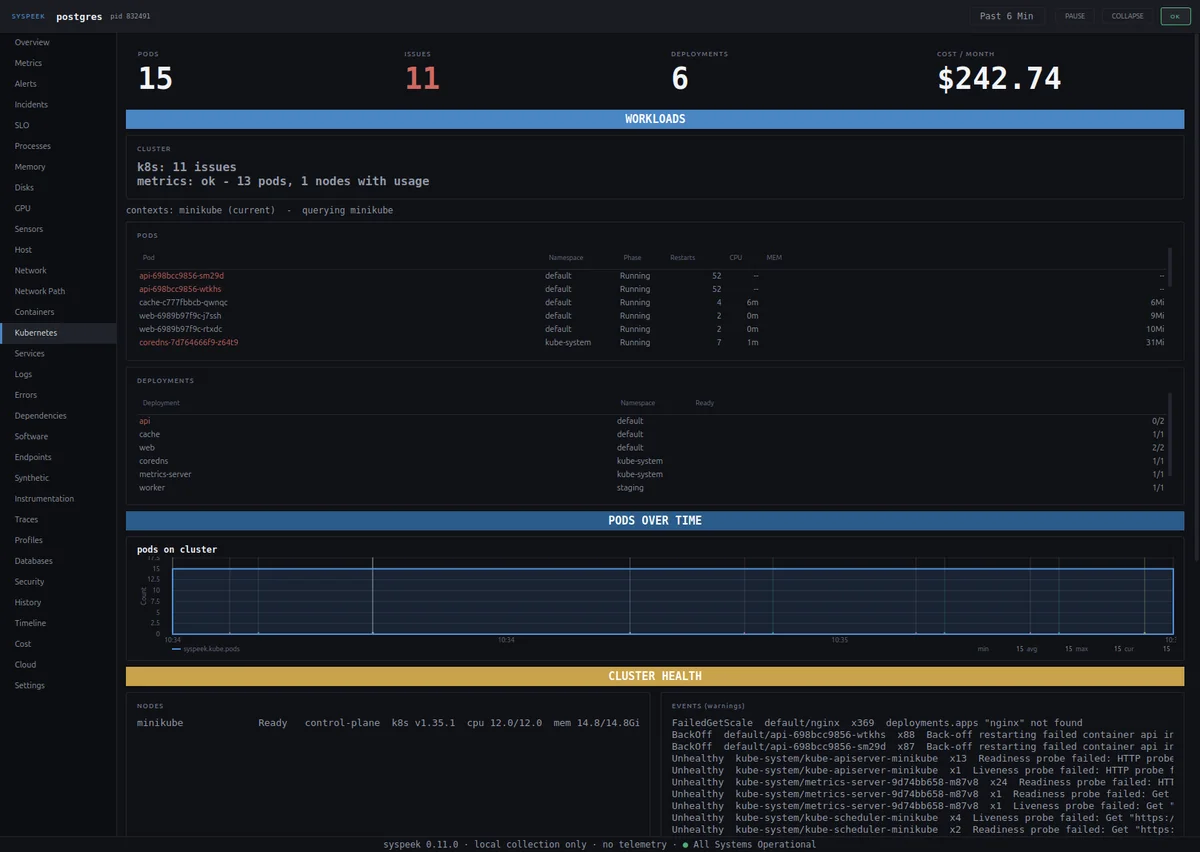
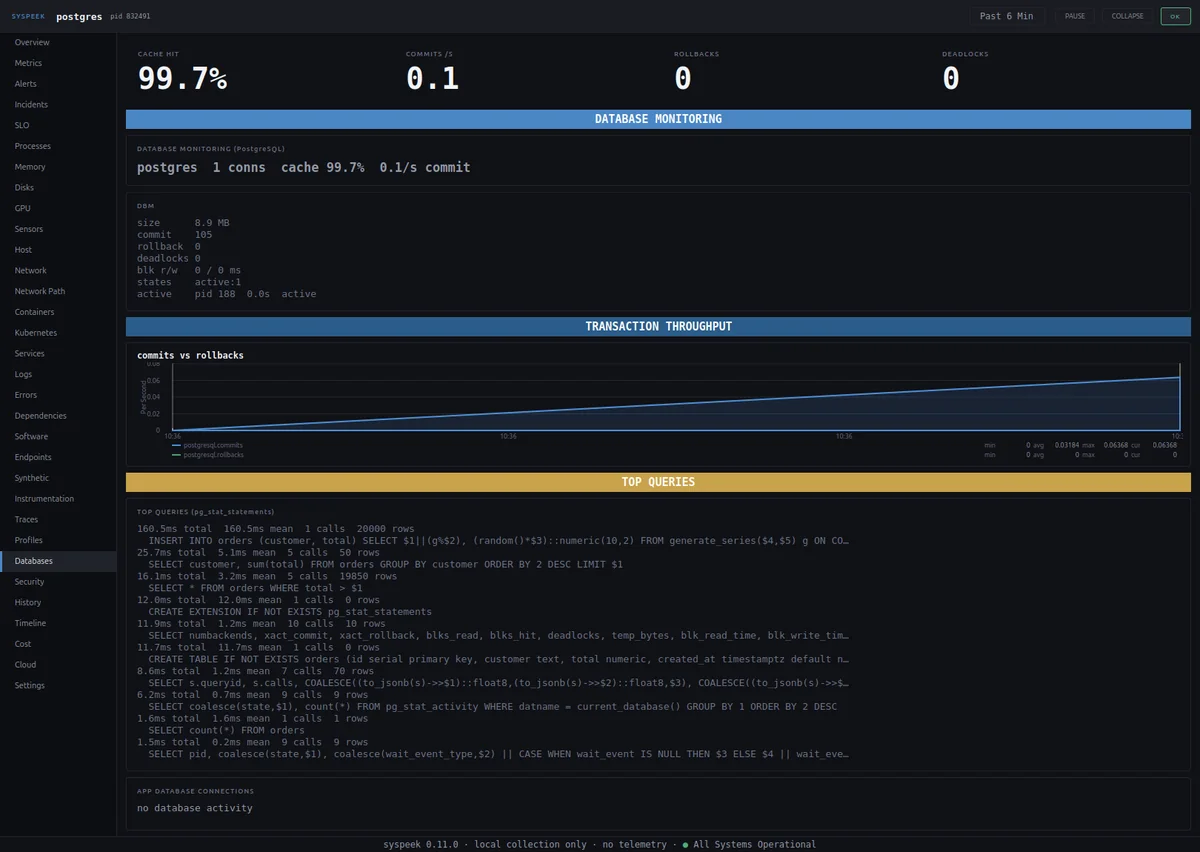
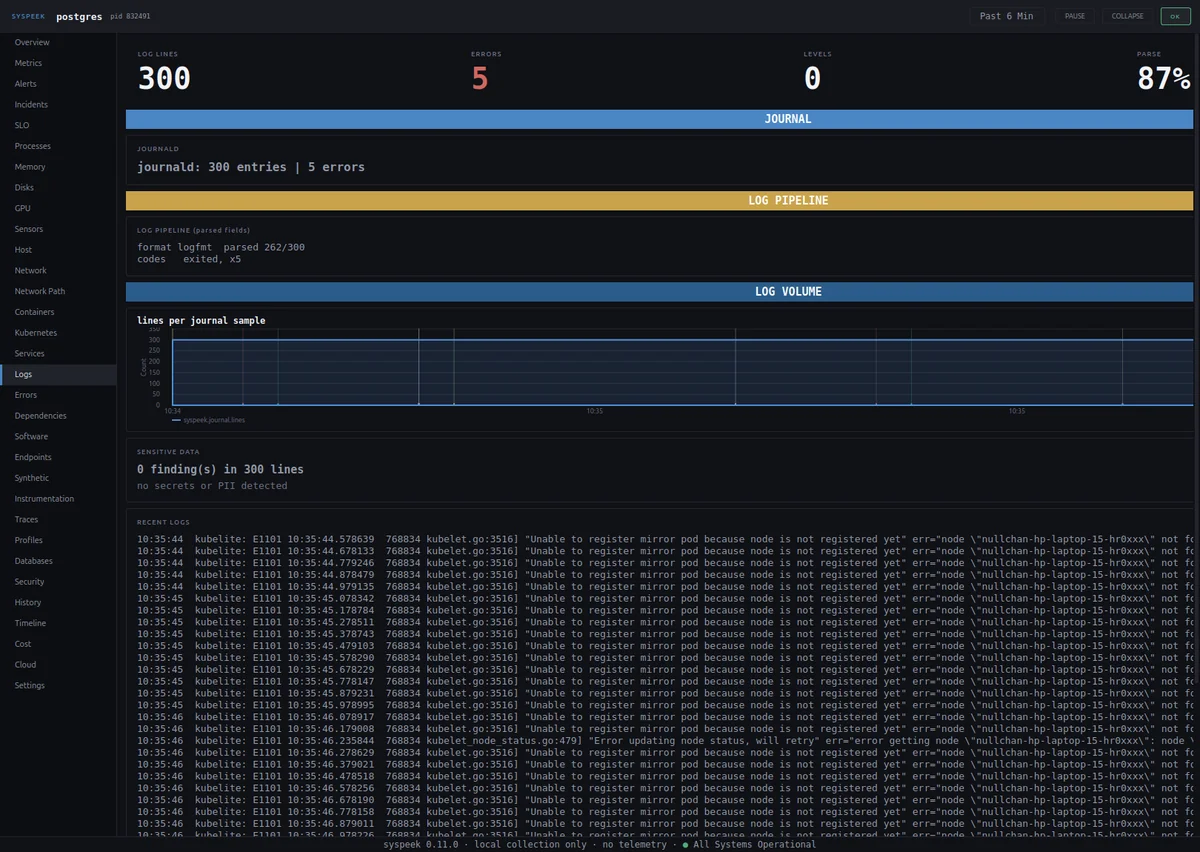
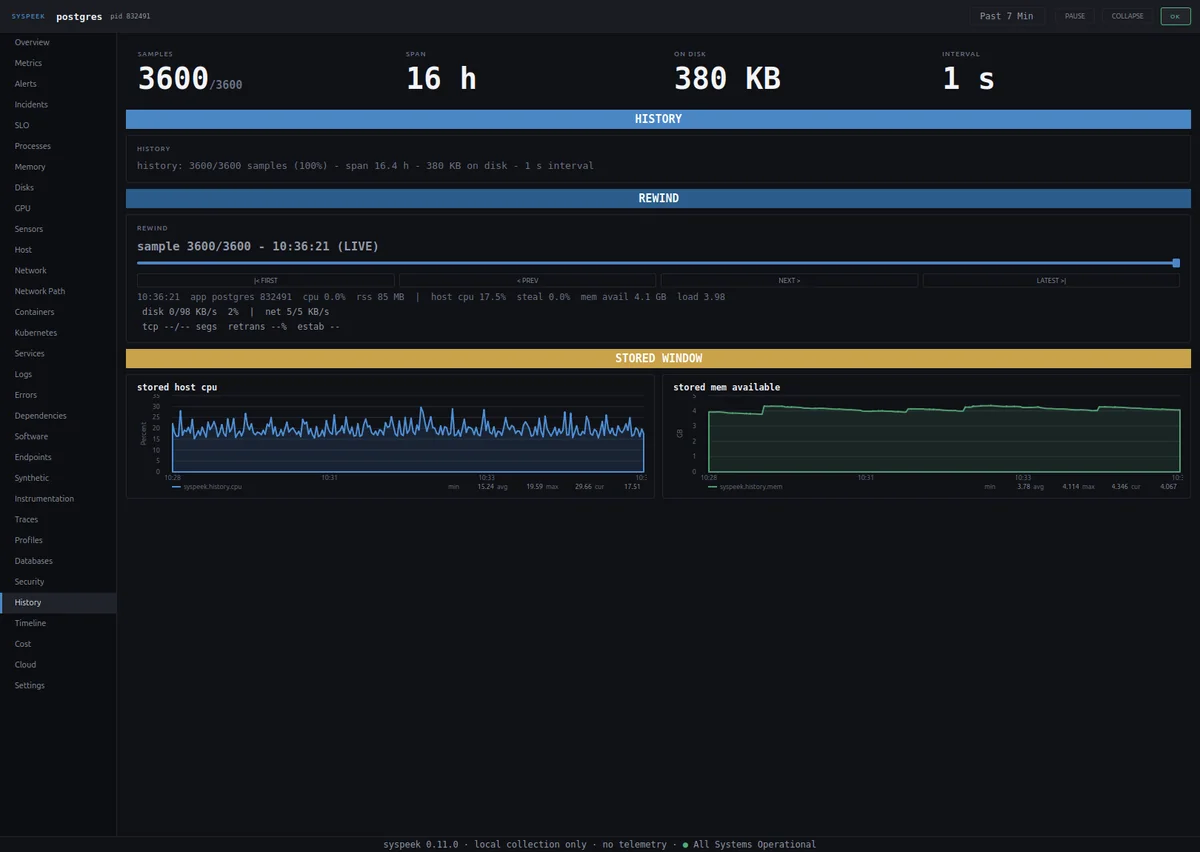
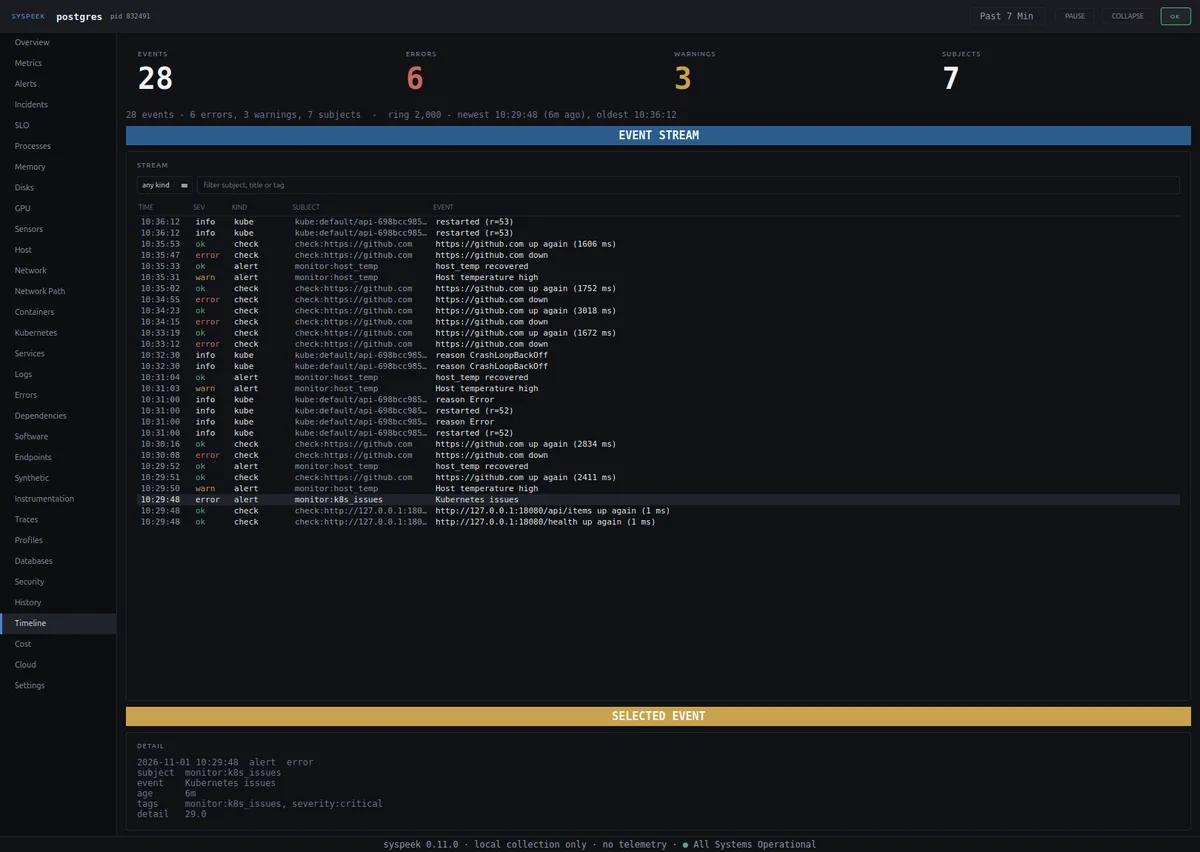
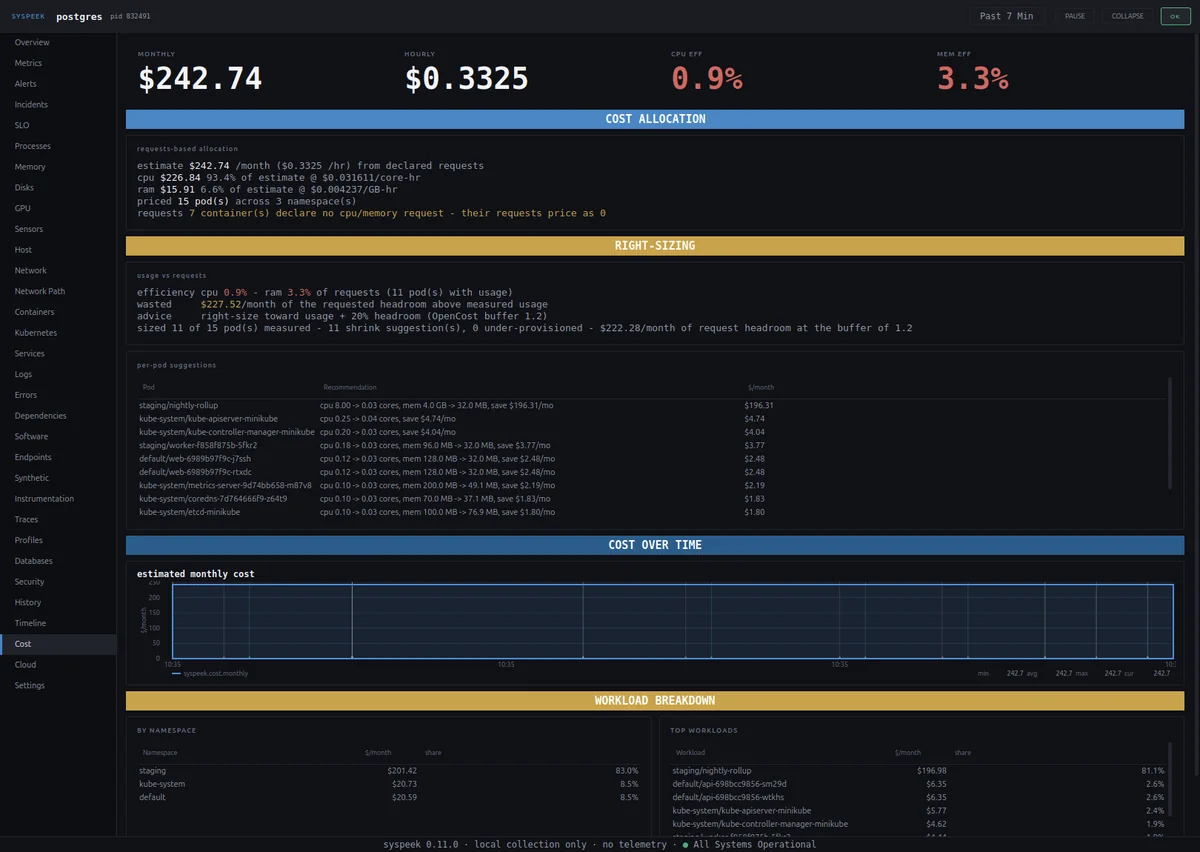
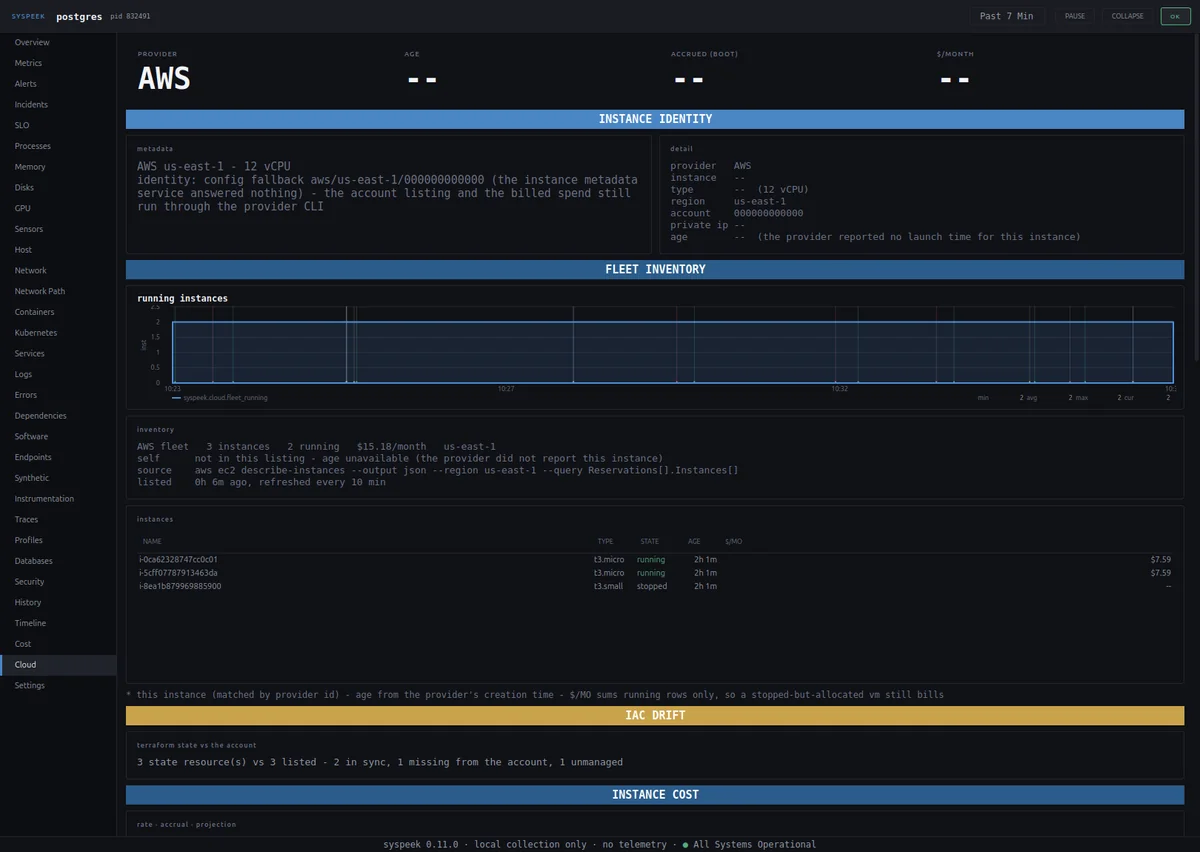
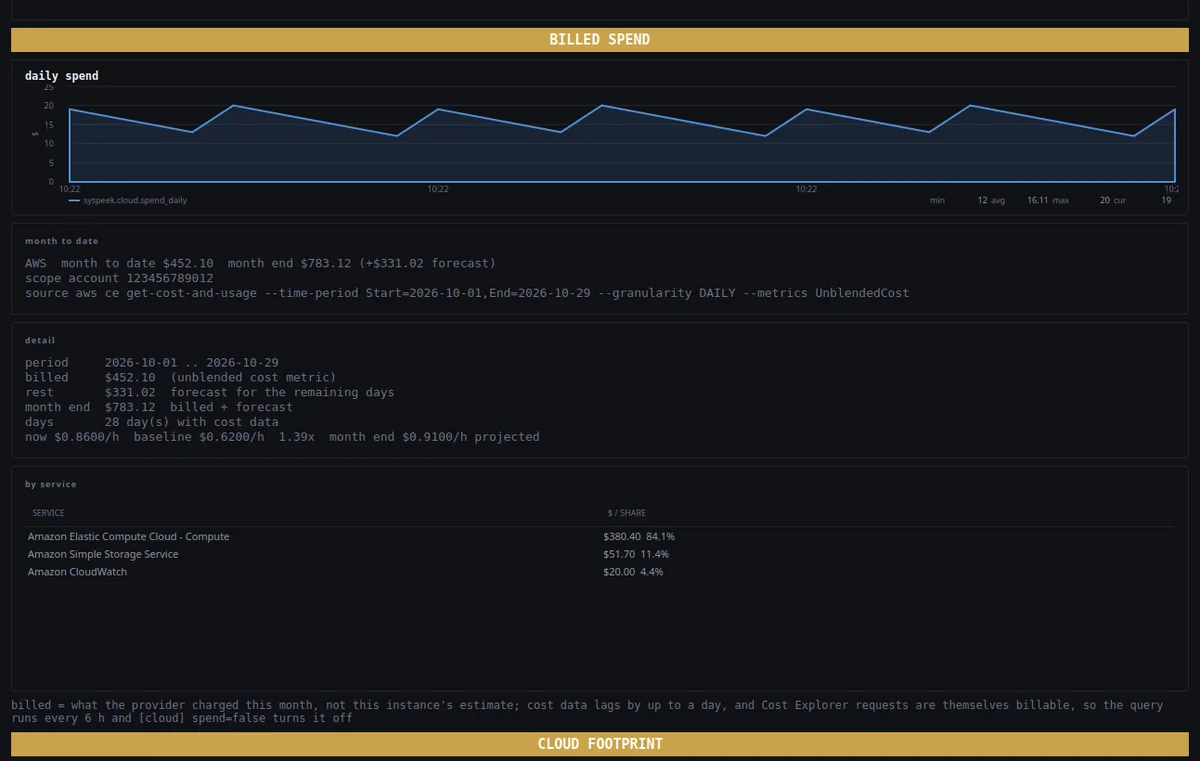
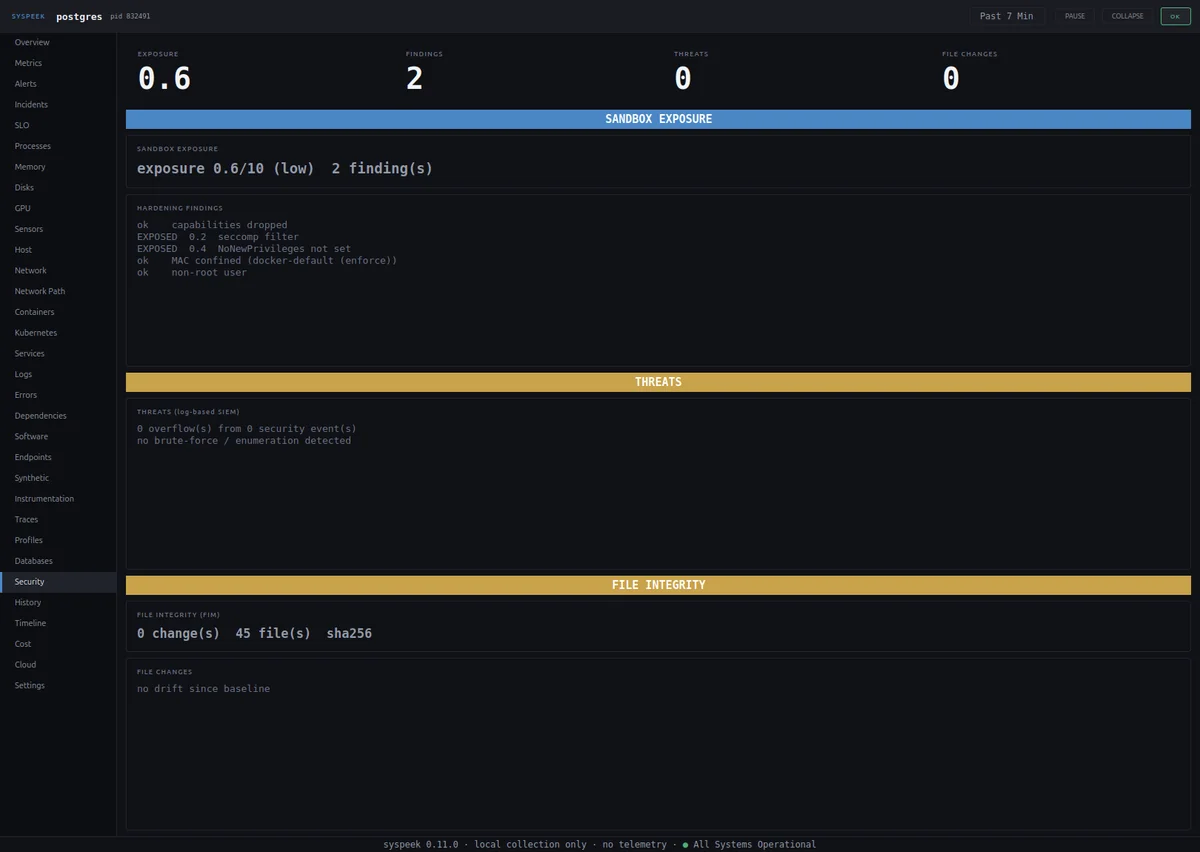
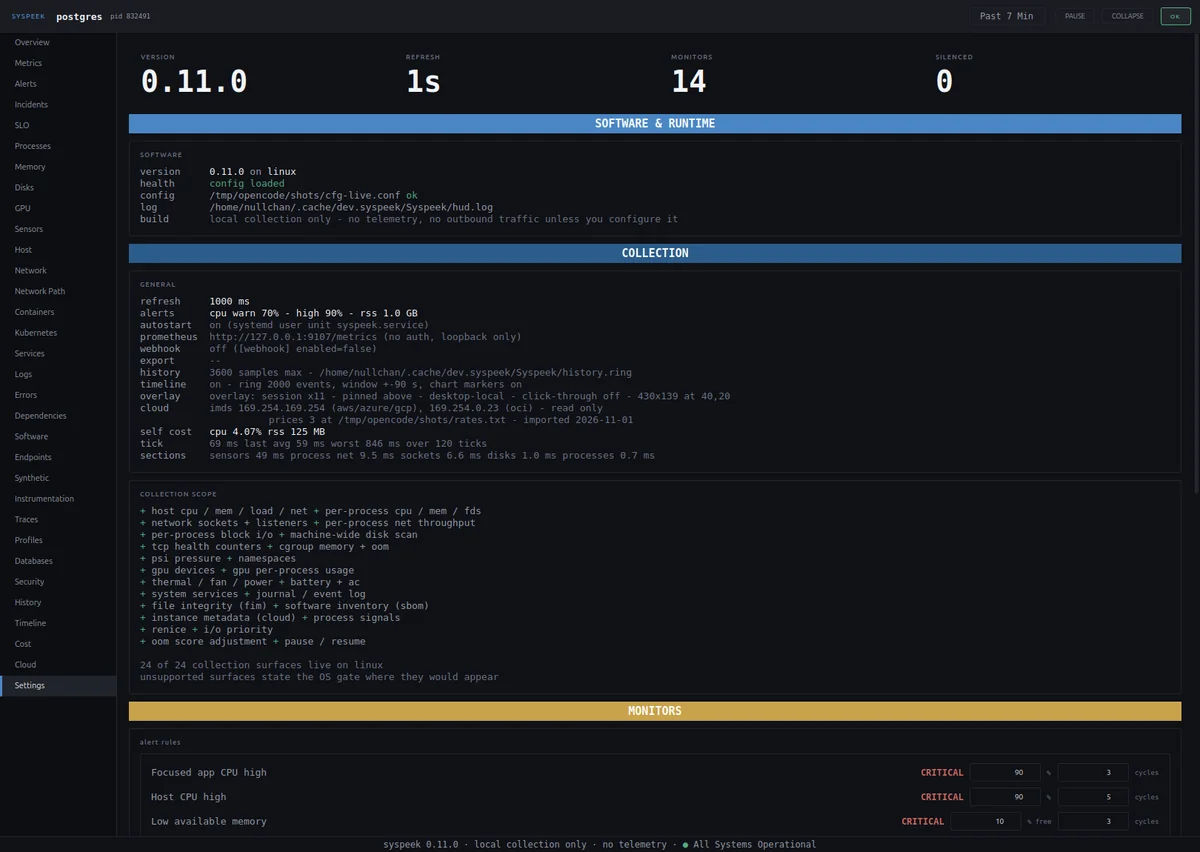
These are live captures of Crowsnest 0.11.0 on one machine — not mock-ups and not a designer's render. The OTLP traces, DogStatsD metrics and synthetic checks are real receiver traffic from small local test clients pointed at the HUD, and the cluster panels are a real single-node Kubernetes cluster with metrics-server. There is no cloud account behind this laptop, so the Cloud panel is a live capture against a local AWS emulator: the identity comes from [cloud] identity= (no instance metadata service exists there, and the card says so), and the instances, the rates and the Terraform diff are the emulator's real API responses decoded by the shipping code. The Billed spend close-up is the one panel rendered from the application's screenshot fixtures — a three-hour-old emulator account has one day of cost, which makes for an empty chart — so treat its numbers as a layout reference and the release notes for what is proven where.
Get started
$ curl -fsSL https://raw.githubusercontent.com/codeafridi/Crowsnest/main/install.sh | sh
Installs for your user only, puts crowsnest on PATH and starts it at login. Runs on Ubuntu, Debian, Fedora, Arch, openSUSE, Alpine and other 64 bit distros with glibc 2.34 or newer. No curl? The installer falls back to wget, busybox, or your package manager.
Prefer a package file? Download the .deb or the AppImage from Releases. The AppImage updates itself over zsync.
$ curl -fsSL https://raw.githubusercontent.com/codeafridi/Crowsnest/main/install.sh | sh
Downloads the latest DMG, copies the app into Applications and turns on login autostart. Needs macOS 12 Monterey or newer. No permissions asked, and the installer clears Gatekeeper for you.
Prefer a package file? Download the DMG from Releases. TCP health is gated on macOS: the kernel will not hand those counters to an unprivileged reader, and the panel says so.
PS> irm https://raw.githubusercontent.com/codeafridi/Crowsnest/main/cpp/packaging/windows/install.ps1 | iex
Open PowerShell, paste the line, done. Installs into your user folder, puts crowsnest on PATH and starts it at login. Needs Windows 10 or newer. No Git Bash required.
Prefer a setup wizard? Download the MSI from Releases. SmartScreen may ask once, choose Run anyway.
After install: crowsnest to run it, crowsnest status to check it, crowsnest stop to quit it, crowsnest update to upgrade.